| FAMSI © 2005: David Wahl |
||
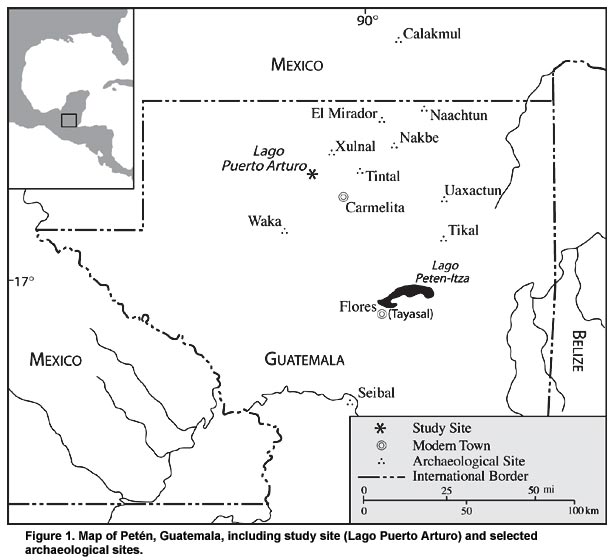
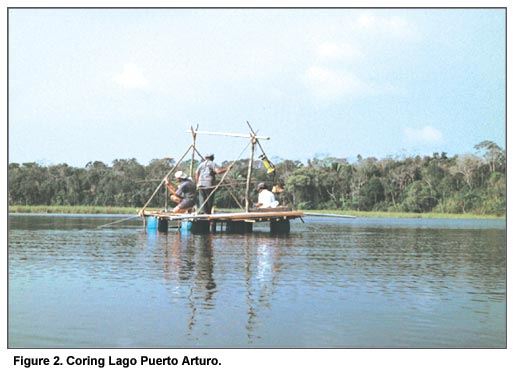
Environmental Change and Prehistoric Agriculture in the Mirador Basin List of Figures Figure 1. Map of Petén, Guatemala, including study site (Lago Puerto Arturo) and selected archaeological sites. Figure 2. Coring Lago Puerto Arturo. Figure 3. Core stratigraphy (digital imagery (A) and x-radiography (B)) shown with density, carbonate content, and magnetic susceptibility. Figure 4. Percent pollen diagram from Lago Puerto Arturo. * = Zea encountered during low power scan. Forest taxa consists of the Moraceae and Urticaceae families; weedy taxa is the Asteraceae family. Figure 5. Results of the oxygen isotope analysis. Line is a 3 pt. running mean.
Table 1. AMS radiocarbon determinations for the Puerto Arturo core. Calibrated ages and age ranges were calculated using Calib 4.4 (Stuiver et al. 1998). aSamples not used in age/depth model. |
||
|
Text links to all pages at this site are available at the FAMSI INDEX |
||